Dashboard Methodology
Liquidity Health Score Formula
S=x∗LS+y∗LC+z∗LO
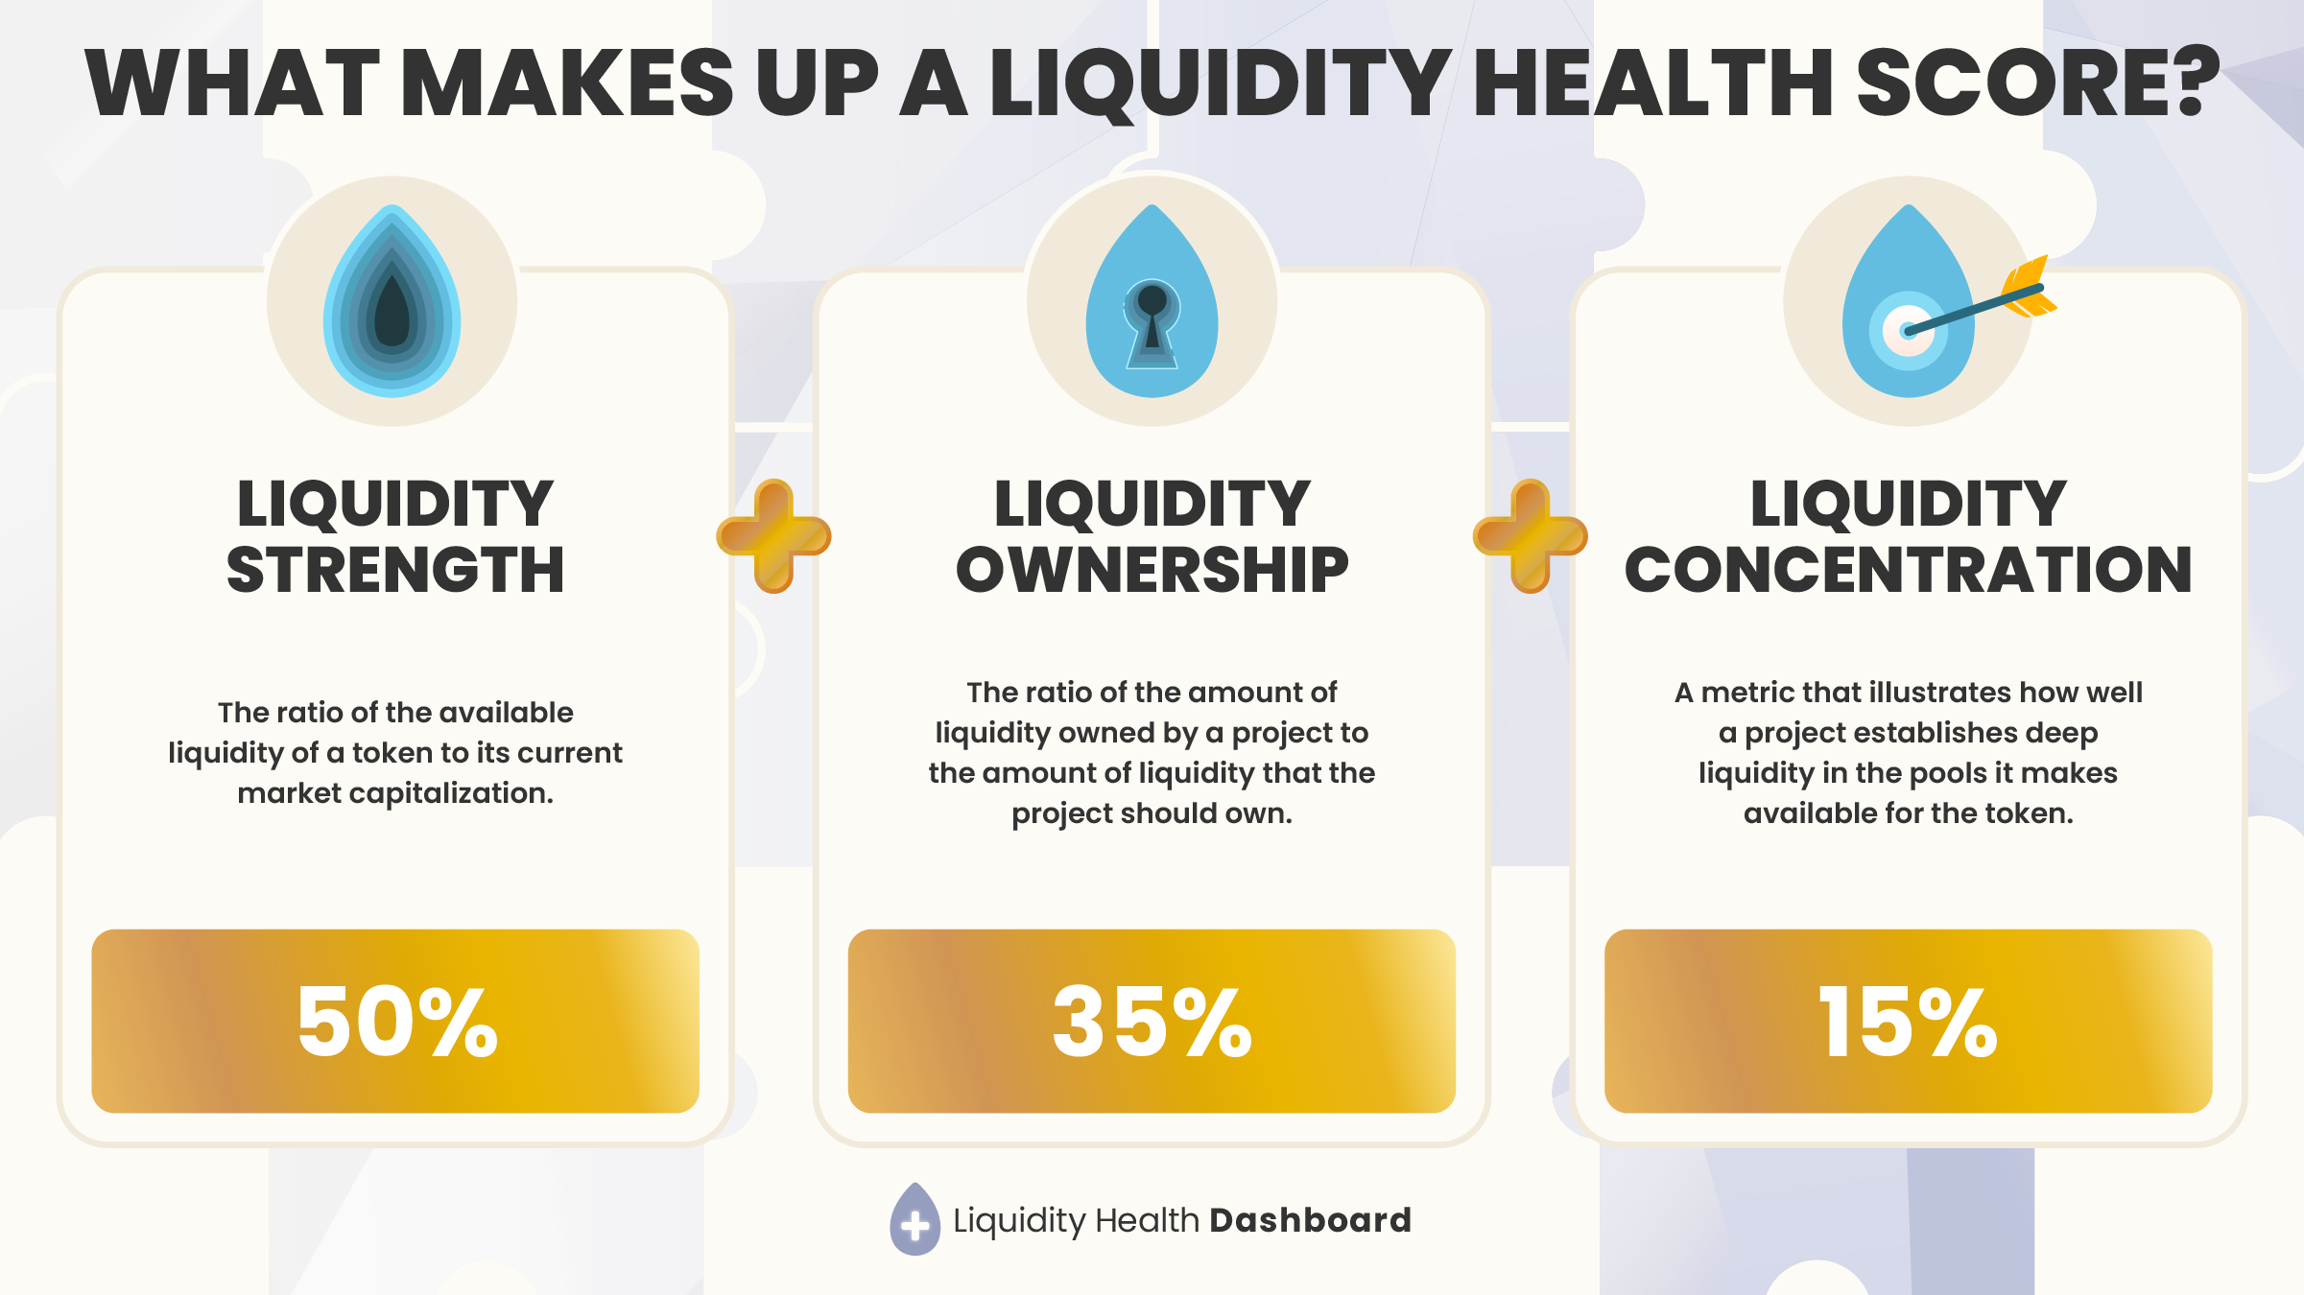
Each of the three components has a weighted coefficient (x, y, and z) to factor in the importance of each feature in the overall score. Currently:
Liquidity Strength (LS) = 50% of score
Liquidity Ownership (LO) = 35% of score
Liquidity Concentration (LC) = 15% of score
These three category scores are then weighted through ApeBond’s custom-built formula above to generate an aggregate Liquidity Health Score on a scale of 0-100. The Liquidity Health Score is the primary metric that will be shown when sharing information from the Liquidity Health Dashboard.

Sustainability Range
The Sustainability Range defines what ApeBond believes is an appropriate amount of liquidity for any given MCAP. This is a range, with an upper and lower bound, we believe if you are inside the range you are in a healthy spot.
This is the backbone of the liquidity health dashboard and the LS and LO scores are derived off this range.
Methodology
ApeBond gathered liquidity data on over 1500 active projects on EVM compatible chains and plotted them on a chart, looking at extractable liquidity and market capitalization.
Through various exploratory analyses on the industry's data, ApeBond created a deep understanding of what tendencies to look for. Using those tendencies, ApeBond modeled a custom function to describe the average behavior and optimized its parameters to fit the industry's current situation.
ApeBond then analyzed that data based on the experience of running a DEX for over two years, knowledge of how consistently crypto projects fail, and working closely with liquidity. It discovered that the industry average is very low, the entire industry does not put enough emphasis on liquidity.
ApeBond then optimized the equation parameters to define the lower bound of the "sustainability range". This included breaking the parameters up for projects below $250M and above, resulting in two formulas that integrated a number of important insights:
The industry is clearly undercapitalized - this is a primary driver why so many token charts are down and to the right.
When a project prints tokens, it must back those tokens with capital. Projects tend to launch tokens, put millions of dollars worth of the token into circulation, then put less than $250k backing the token. That degree of leverage is typically impossible to sustain.
Newer projects need more liquidity backing their token. With a smaller MCAP, there is more risk, as the project is less established, and needs a better trading environment to start.
All tokens need liquidity backing the token. If a project has no liquidity backing the token, then the token is worthless. If one cannot sell it for a hard asset, it is effectively worthless.
ApeBond then further pressure tested this model with slippage and price impact analysis on how much liquidity a project needs to be able to facilitate reasonable trade sizes with a slippage tolerance of roughly 5% and a price impact tolerance of 10%. This validated the model even further.
Summary
ApeBond used the industry average as the backbone of the sustainability range, defining an industry formula with tunable parameters. It then used the constant product formula, slippage and trade size analysis, and logical arguments from working with over 250 projects to dial in a final sustainability range.
Last updated
